E-Commerce Statistics and Infographics: Benchmark Your Conversion Rate
E-commerce statistics and benchmarkings matter if you need to set smart goals for online selling.
How many visitiors can i attract? What should be a realistic goal for overall conversion rate and devices? Where am i compared to the industry?
There are a lot of questions and should be. But for sure, it is not practical to search for answers to all. Instead, we should focus on the smart questions that matter for our success and infographics are very strong tools to summarize the key metrics. For this reason, i gathered some data and filtered the most important parts to get useful insights. Then i designed some infographics containing key e-commerce statistics that may be useful for benchmarking. I will share some ideas and insights in this post.
Lets start with a short review of last year.
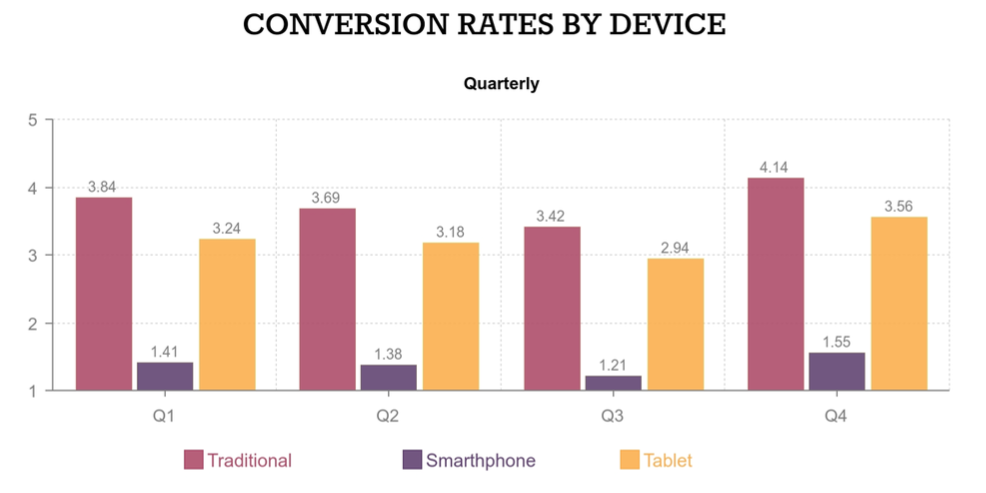
The overall e-commerce conversion rate was 2.85% and US average was 2.76%. You can also find the conversion rates by device types below.

Industry Averages
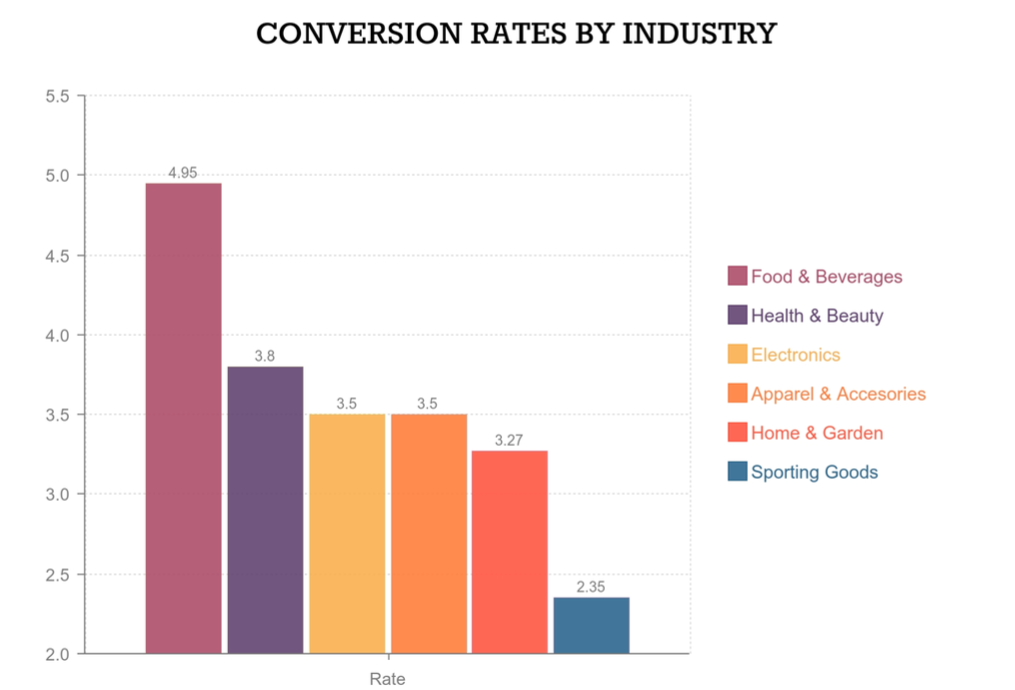
What about the industry averages? Food industry has the biggest conversion rate by far followed by health&beauty.

Smartphone Traffic Growth
One important insight from the data was the growth of smartphone traffic as we can expect. In last year, the overall traffic is increased as only 1% but smartphone visits are increased as 33%. So my key takeaway is “smartphones drive e-commerce growth”.
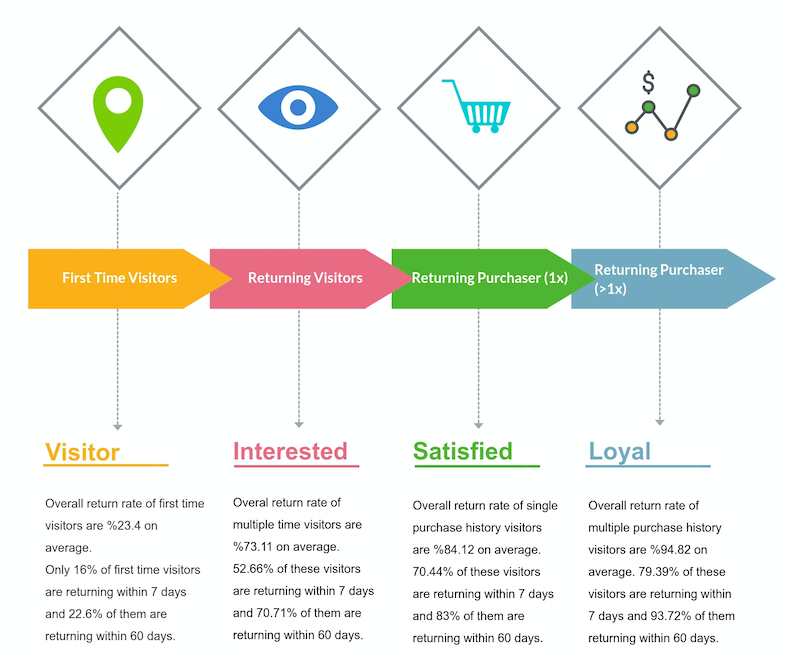
Traffic is not the only success factor of course. You need to plan some actions for retention.Spend effort to return your visitors and customers because overall return rate of multiple purchase history visitors is impressive as 94.82%.

Mobile vs. Desktop
All of us can easily see the mobile trend in daily life. But you can’t measure it by just observing. Lets continue to view more e-commerce statistics. In Q1 of last year, desktop had a ratio 49% and smartphone had a ratio 36% in overall visits. In Q1 of this year, desktop had a ratio 42% and smartphone had a ratio 45% in overall visits. Within 1 year, this change seems dramatic and deserves attention. For most companies, mobile traffic is greater than desktop. But when it comes to purchasing, the situation changes. People spending their %59 of the time on mobile, but they spend only 15% of the money on mobile site or app. There seems a trust issue on mobile about purchasing and most people purchase on web site after visiting mobile site. But this is also changing despite slow acceleration. Mobile shopping increased as 7% in last year.
User Experience (UX) Importance
Your sales may be much more in mobile or vice versa. In either cases, you should focus on user experience. 40% of visitors go to competitors after a bad mobile experience so never underestimate the UX for mobile!
